Stock Levels
Automatically generates plots allowing you to quickly review volumes in a graphical format
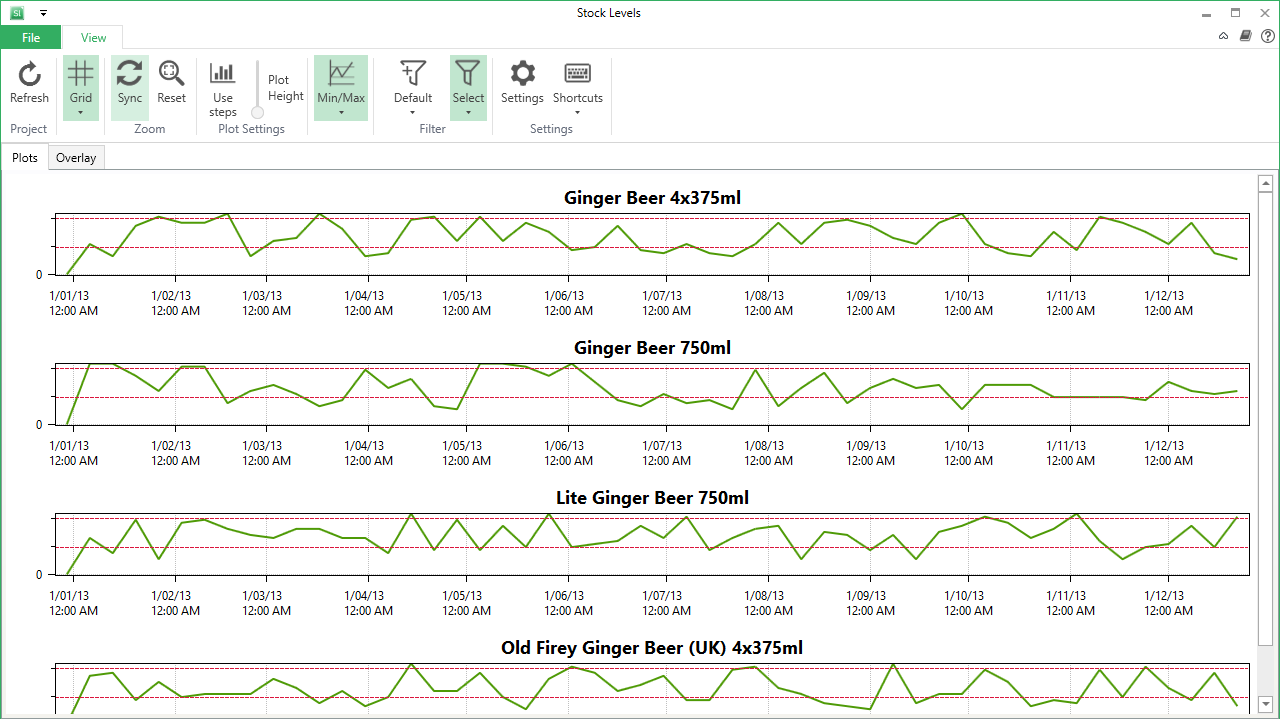
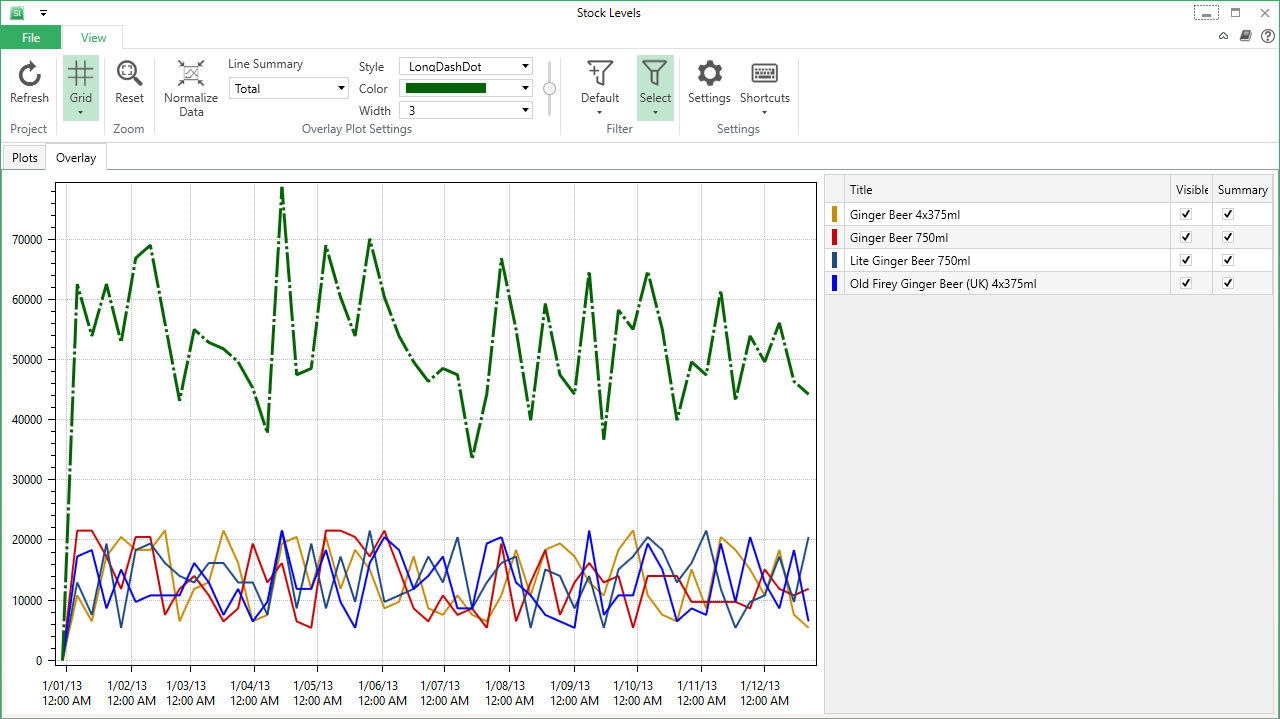
| Individual charts | Overlaid with totals |
|---|---|
 |
 |
Quick Plots
Being able to quickly see volumes as plots allows you to spot trends, issues and other interesting facts you can't easily identify when looking at the values themselves in a spreadsheet.
Simple comparisons
Quickly apply filters to show items with similar attributes and then compare volumes easily.
Visual trend analysis
With the overlay window you can easily add a total line to show you total volumes for a group of products. The filter allows you to quickly select which products should be included in the group. Our overlay view also allows you to look at the average trend and then visually compare other products to the trend so that you can quickly judge whether or not they fit the overall pattern. Grouping items into families like this is very useful when you need to do forecasting across a range of products.